Procurement Intelligence
Beyond Your ERP.

Horaxis Enterprise is an intelligence layer that sits on top of SAP, Oracle, or Dynamics 365 to predict delivery failures, monitor external risks, and automate supplier engagement — all deployed on-premise inside your network.

Command Center

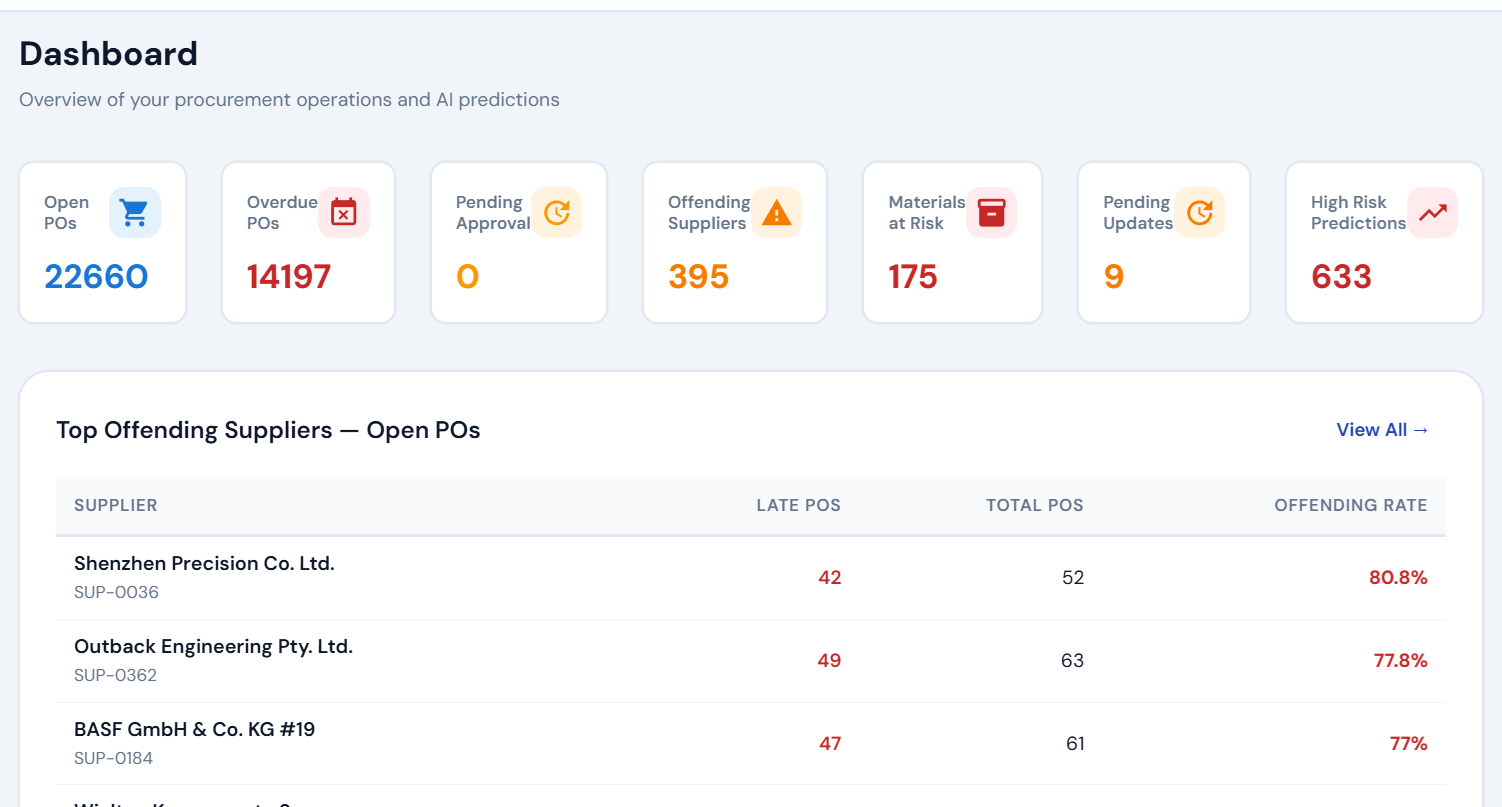
Operational Dashboard

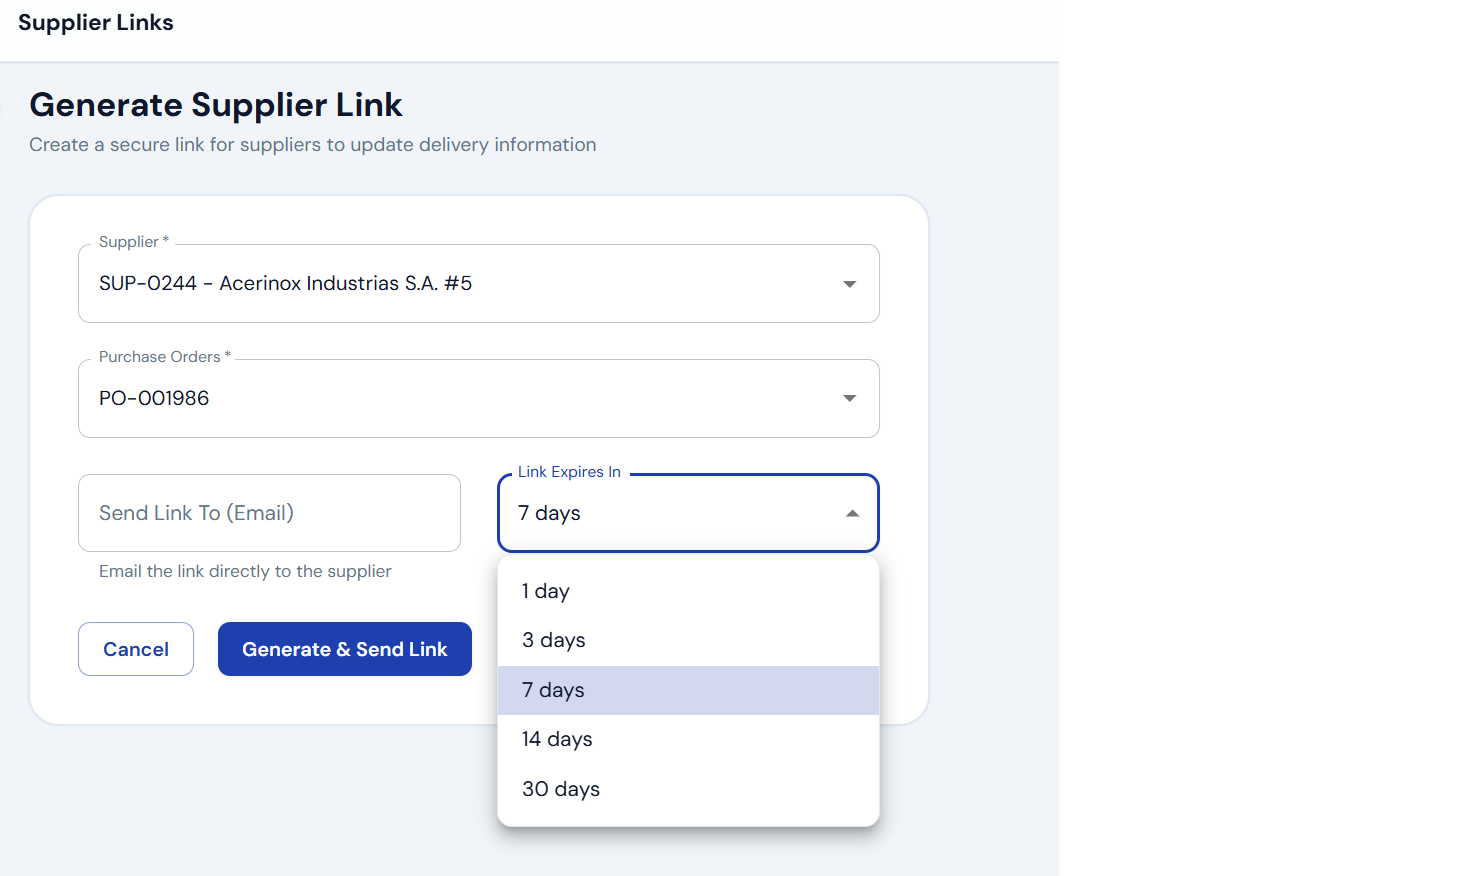
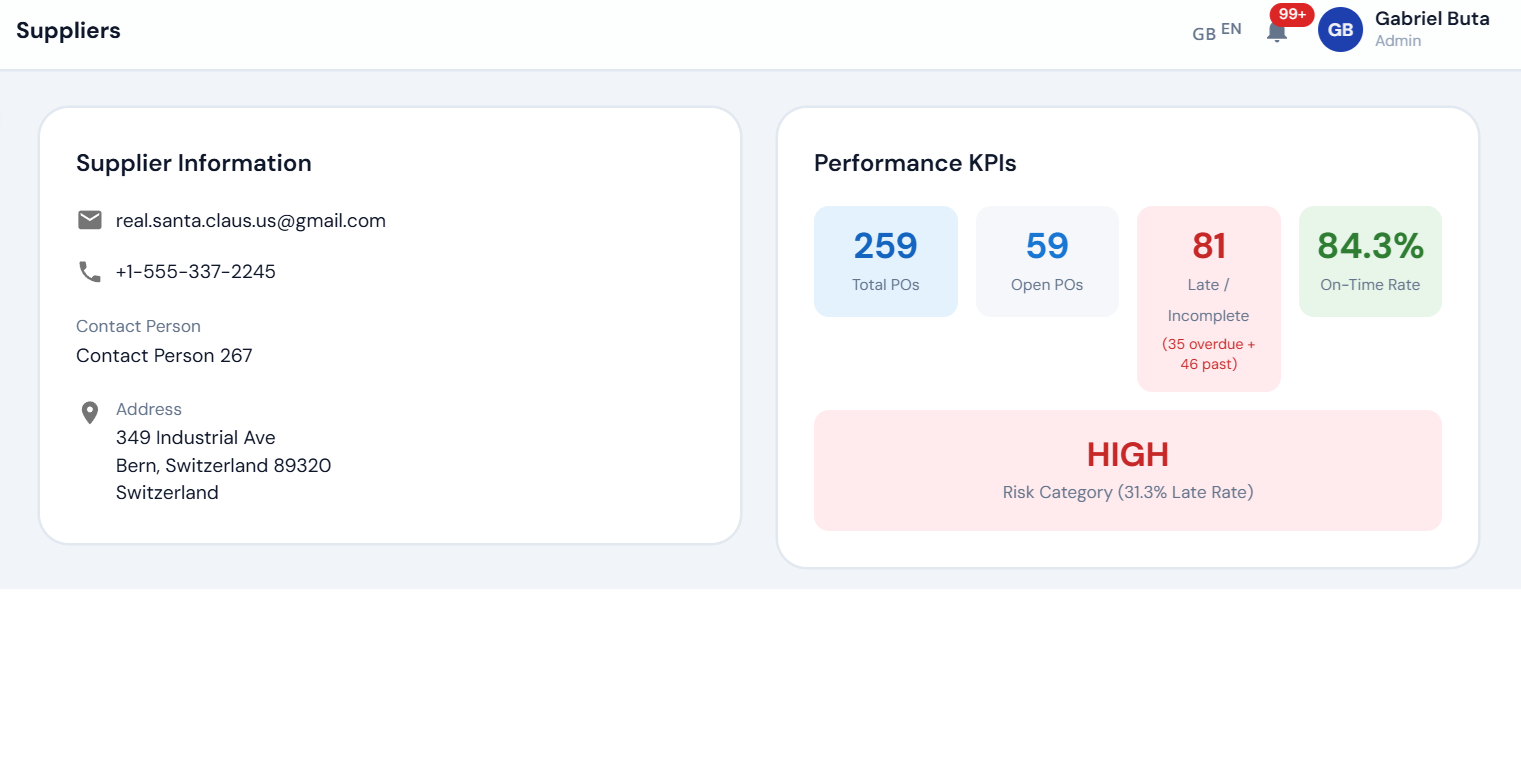
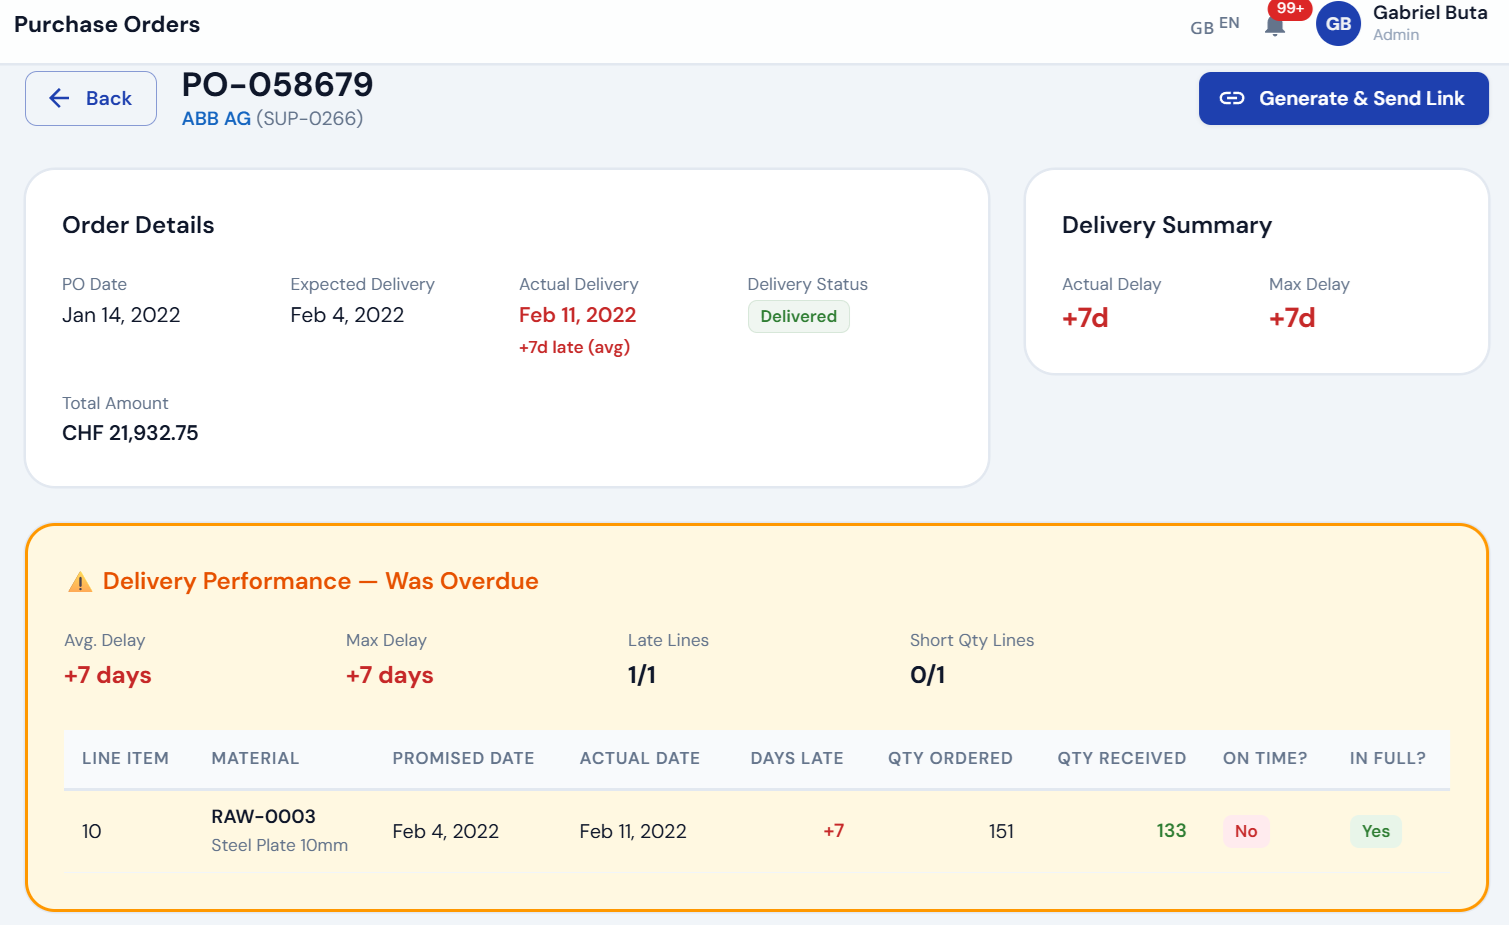
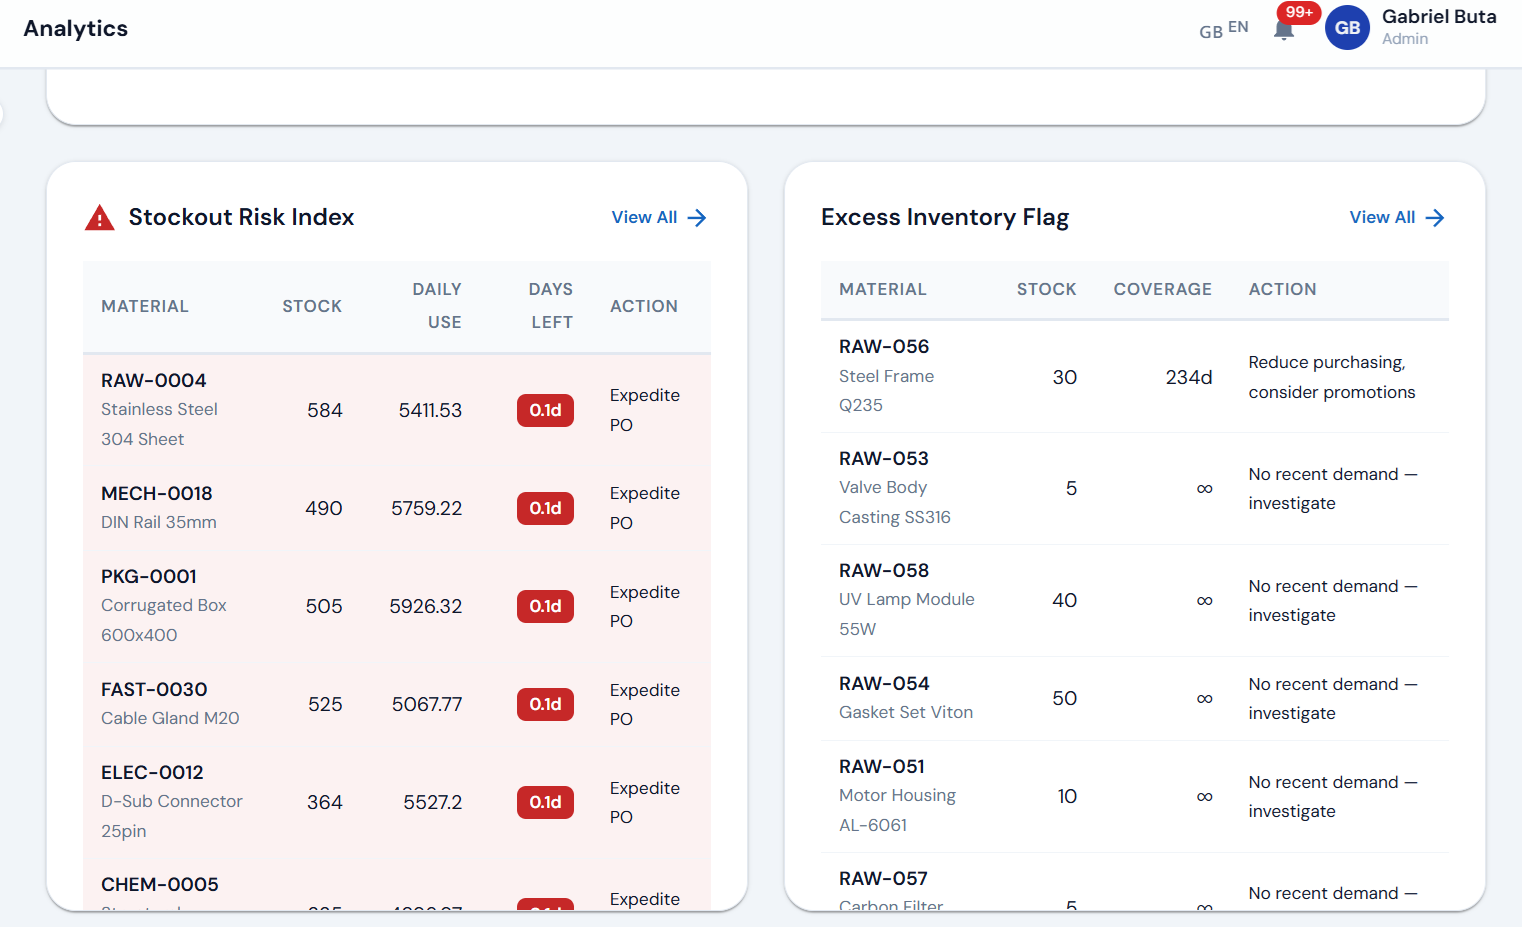
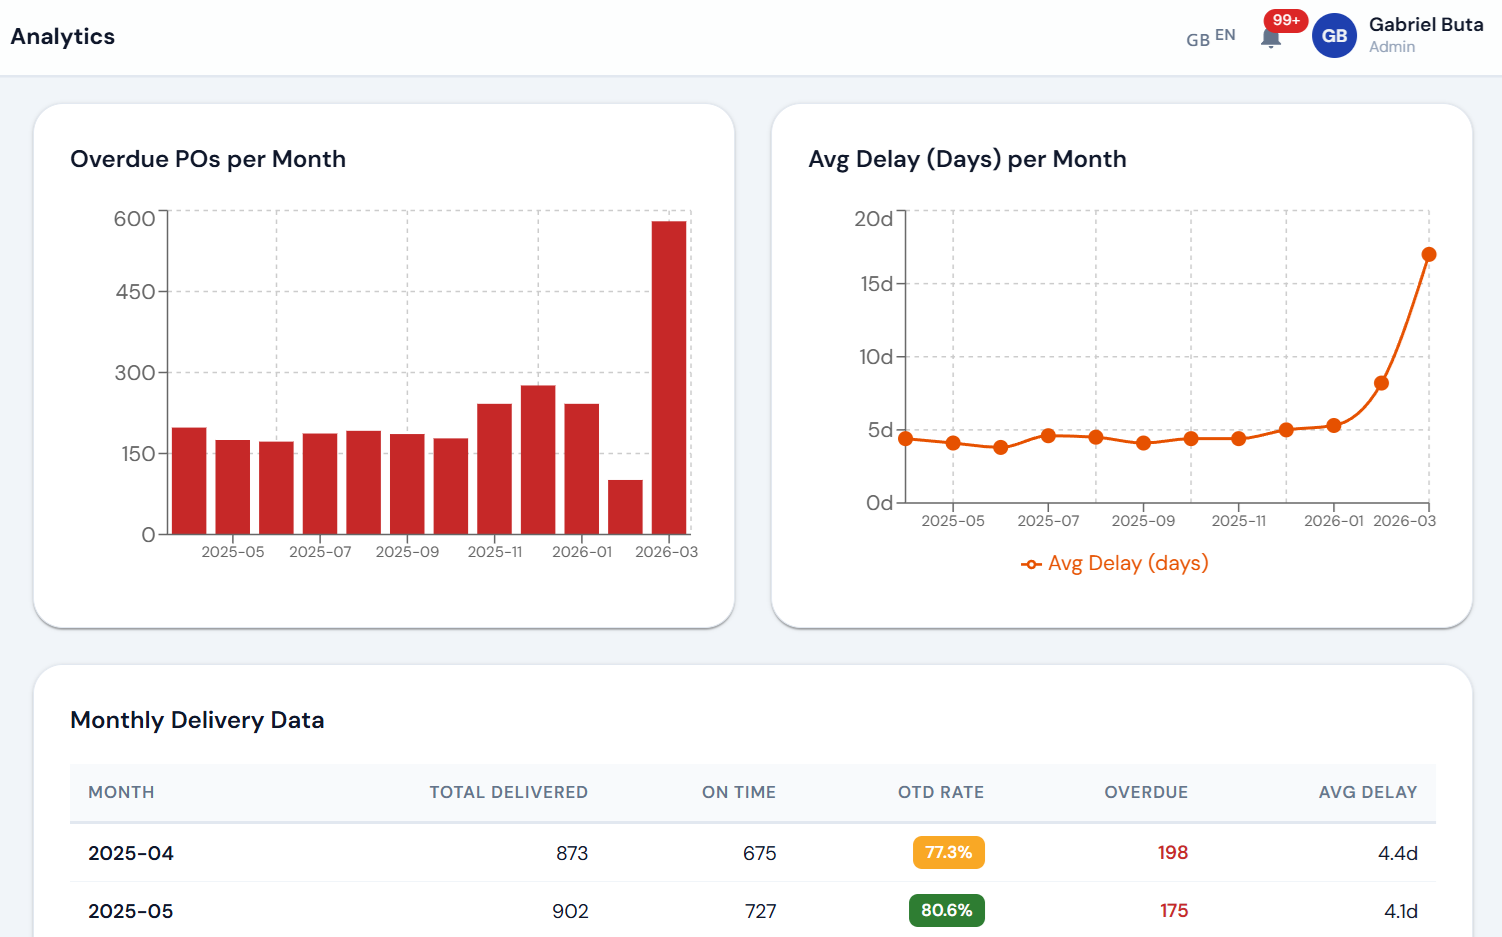
A single view of your entire procurement health. Seven KPIs tracked in real-time: open POs, overdue POs, offending suppliers, materials at risk, high-risk ML predictions, and pending supplier updates.

  • Top offending suppliers ranked by late delivery rate
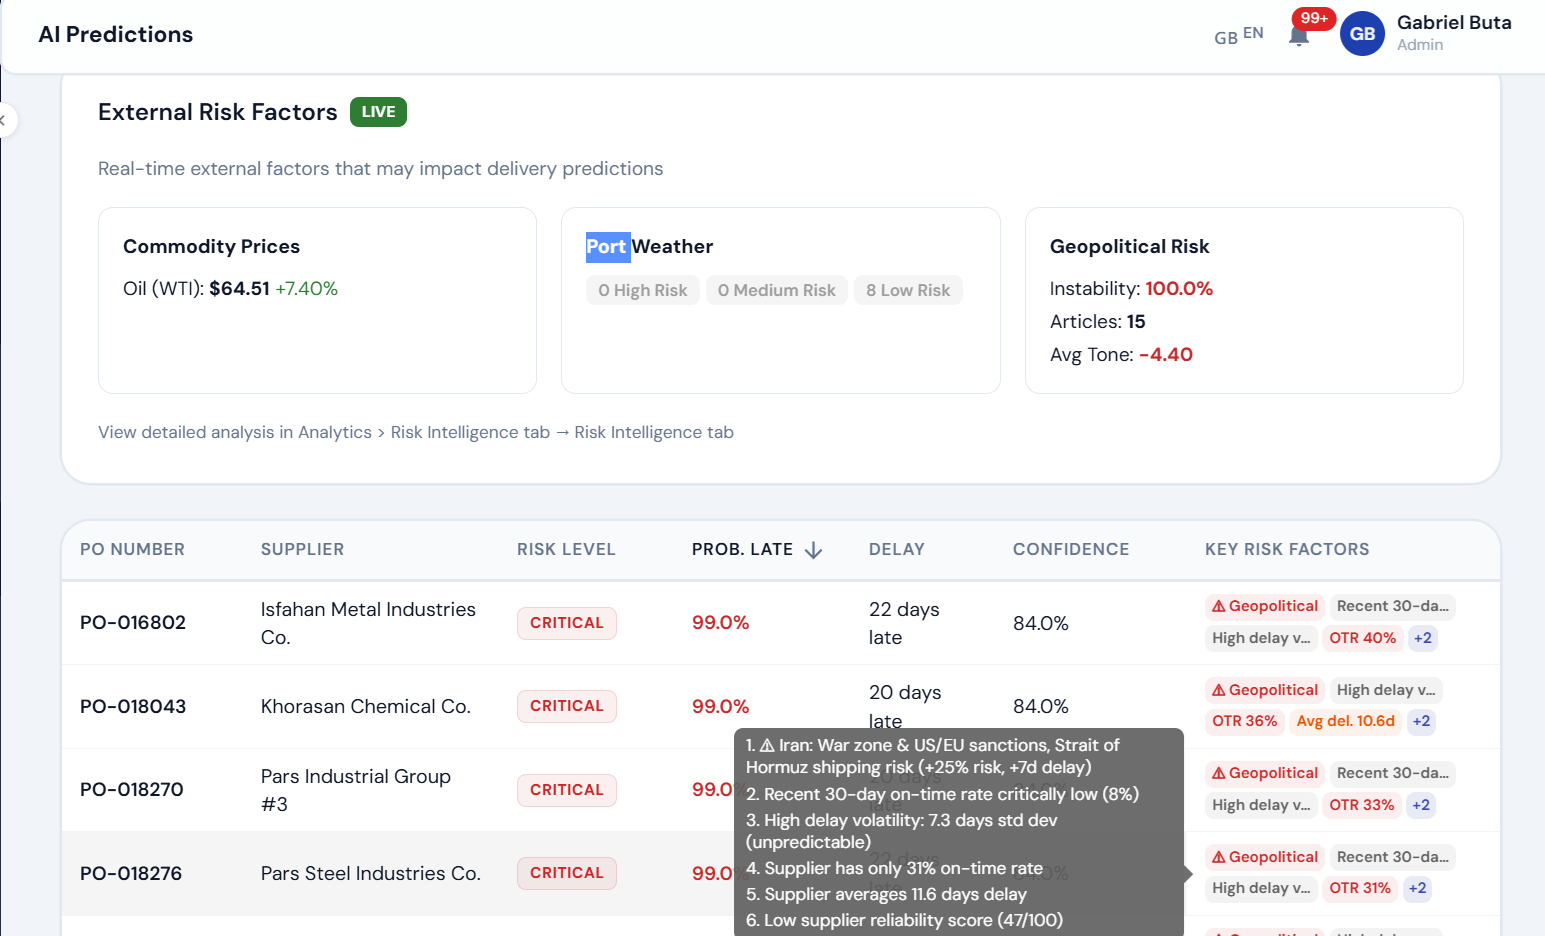
  • High-risk predictions surfaced with probability scores
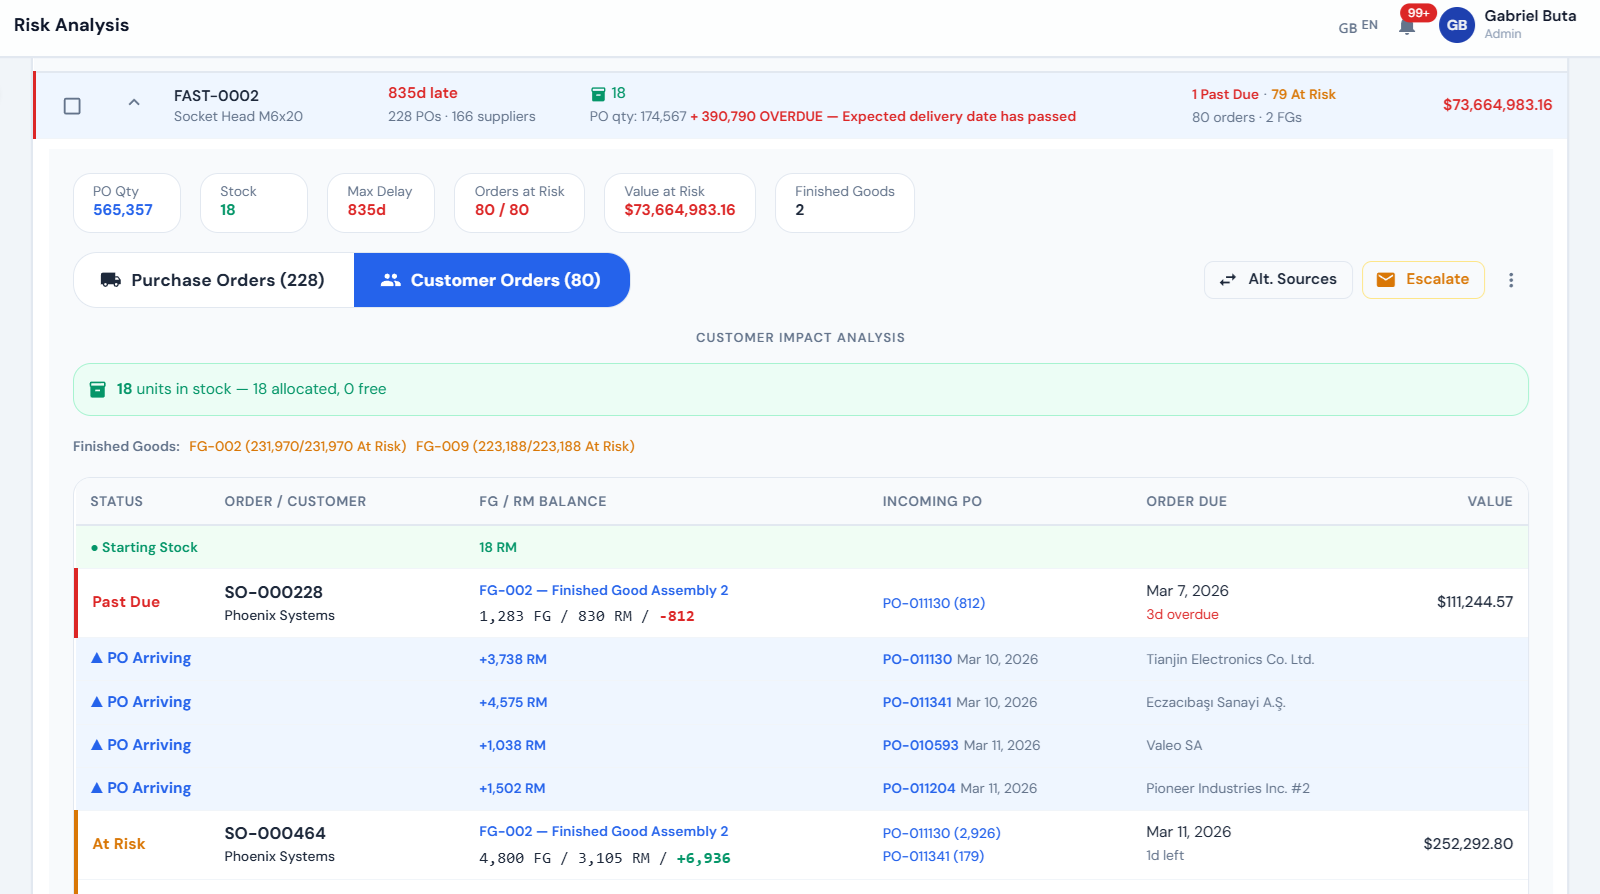
  • Materials at risk linked to affected customer orders
Horaxis Enterprise Dashboard with 7 KPIs and offending suppliers table
Machine Learning

35-Variable Late Delivery Prediction

A two-model ML ensemble (Random Forest + Gradient Boosting) combines your ERP delivery history with live external signals to predict late deliveries 14+ days in advance. Each purchase order gets a risk score, predicted delay in days, and explainable risk factors.

  • Supplier behavior patterns: on-time rate, delay history, date volatility
  • External signals: port weather, vessel tracking, commodity prices, geopolitical disruptions
  • Operational context: BOM complexity, lead time bias, quantity variance
AI Predictions showing external risk factors and late probability per PO
8 Live Data Feeds

External Risk Intelligence

Horaxis Enterprise continuously monitors real-world conditions that affect your supply chain. Eight specialized risk engines scan geopolitical events, commodity markets, weather systems, vessel movements, waterway levels, and currency volatility — all scored and integrated into your ML predictions automatically.

  • GDELT geopolitical disruption scanning (strikes, embargoes, port blockades)
  • Metals and commodity price tracking (copper, aluminum, fuel, natural gas)
  • Forex volatility monitoring (EUR/USD spread risk)
Risk Intelligence dashboard with commodity prices, geopolitical risk, vessel tracking
Live Monitoring

Port Weather Conditions

Real-time weather data for 20+ major port cities worldwide, sourced from NOAA (US ports) and Open-Meteo (global). High winds, fog, storms, and heavy precipitation are automatically detected and scored as supply chain risk factors.

  • Wind speed thresholds: crane suspension at 50 km/h, port closure at 60 km/h
  • Visibility monitoring: dense fog alerts below 500m
  • Severe weather codes: thunderstorms, heavy snow, freezing rain
Port Weather Conditions cards showing live temperature, wind, precipitation data
End-to-End Traceability

BOM Impact & Customer Orders at Risk

When a delivery is late, Horaxis Enterprise traces the impact through your entire Bill of Materials — up to 10 levels deep. It maps exactly which raw materials are affected, which finished goods depend on them, which incoming POs provide coverage, and which customer sales orders are at risk. The system also checks for substitute materials that could fill the gap and gives you one-click escalation tools so you can act on problems the moment they appear — not after they snowball.

  • Recursive BOM explosion with accumulated quantities
  • Customer order coverage analysis: covered vs. at-risk
  • Value at risk calculation per affected sales order
  • Substitute material detection across your approved supplier base
  • One-click escalation to buyers, planners, or supplier contacts
  • Automatic alerts and email notifications when a PO status worsens — so the right people know before it becomes a line-stop
Risk Analysis showing BOM impact chain from raw material to customer sales orders
Zero-Friction Collaboration

Secure Supplier Portal Links

Generate secure, time-limited links that let suppliers update delivery dates, confirm quantities, and provide ASN data — without needing a login or account. Each link uses a cryptographic token, expires automatically, and tracks all submissions with timestamps and IP addresses.

  • No login required for suppliers — one-click access
  • SHA-256 hashed tokens with configurable expiration
  • All submissions timestamped, tracked, and auditable
Supplier Links management page showing secure link generation
Supplier Intelligence

Performance Tracking & Reliability Scoring

Every supplier gets a composite reliability score based on on-time rate, in-full rate, average delay, and recent 90-day trend. The system automatically identifies offending suppliers and tracks whether performance is improving, stable, or declining.

  • Composite reliability score (0-100) across four weighted factors
  • Trend analysis: recent 90-day performance vs. all-time
  • Delivery history with detailed per-PO tracking
Supplier detail page with performance KPIs and delivery history
Operational Detail

Purchase Order Tracking

Full visibility into every purchase order with line-level detail: delivery dates, quantities, confirmation status, and date change history. Track delivery performance from the moment a PO is created through goods receipt.

  • Line-level delivery date tracking and date volatility history
  • Supplier confirmation status and acknowledgment gaps
  • Goods receipt tracking with quantity variance detection
PO detail page with delivery performance tracking and line items
Inventory Analytics

Stockout Risk & Excess Inventory Detection

Automated analysis of your inventory position across all material lines. The Stockout Risk Index calculates days of supply remaining based on daily consumption rates and flags materials that need urgent PO expediting. The Excess Inventory Flag identifies overstocked materials with no recent demand.

  • Days-of-supply calculation per material line
  • Actionable recommendations: expedite PO, reduce purchasing
  • Coverage analysis for materials with infinite stock vs. zero demand
Stockout Risk Index and Excess Inventory Flag analytics
Trend Analytics

Delivery Performance Trends

Monthly delivery trend analysis with visual charts tracking overdue POs, average delay days, and on-time delivery rates over time. The Monthly Delivery Data table provides granular OTD rates, overdue counts, and average delay figures for each month.

  • Overdue POs per month with bar chart visualization
  • Average delay trend line showing deterioration or improvement
  • Monthly OTD rate tracking with color-coded performance indicators
Delivery trend charts showing overdue POs per month and average delay trends

See It In Action

Request a pilot proposal tailored to your ERP environment and procurement volume.

Request Pilot Proposal How It Works